Table of Contents
Key Takeaways
- Trade-in payouts surged in 2025: Q1 hit $1.24 billion, Q2 reached $1.34 billion, and Q3 climbed to $1.59 billion.
- National stats mask local gaps: City-level pricing data is scarce, but real-world differences of 10–25% can appear during holiday promos.
- Taxes, demand, and logistics shape value: Your ZIP code, local sales tax rules, and promo intensity drive what you actually net.
- Holiday windows are hot: Dec 17–Jan 2 sees frequent quote bumps, ad flips, and gift-card stackers—perfect for a fast five-city test.
- Cash vs credit math matters: In some states, credits lower taxable amounts; in others, third-party cash wins by 20–50%.
Why This Matters Right Now
Trade-ins are on fire this year. In Q1 2025, payouts hit $1.24 billion, up about 40% year over year, and the average device age at trade-in was 3.82 years. In Q2 2025, payouts rose to $1.34 billion, up about 60% year over year. The average age climbed to 3.88 years. The iPhone 13 led the charts again, and the Galaxy S22 Ultra 5G was the top Android. Four out of five top devices were 5G-ready.
By Q3 2025, industry trackers show payouts reached about $1.59 billion, setting new highs into late year. At the same time, global phone shipments were soft. Yet US trade-in values still jumped. Big promos and rich credits helped fill the gap.
So this is the moment. But here’s the twist: national stats are huge, but your number is local. This city phone trade-in comparison 2025 will help you spot regional bumps and time your trade like a pro.
The National Surge, in Plain Terms
Big money to consumers: $1.24b in Q1 2025 (+40% YoY), with average device age at 3.82 years; iPhone 13 led, and Galaxy S22 Ultra 5G led Android.
Record Q2 momentum: $1.34b payouts (+60% YoY), device age 3.88 years, 5G models made up most of the top traded list.
Q3 kept climbing: about $1.59b flowed to consumers.
What Drove the Jump?
Hot promos and AI buzz: Heavy offers from carriers, stores, and phone makers fueled upgrades to AI/5G models even while people held devices longer.
Budget pressure: With economic uncertainty, more people used trade-ins to lower the cost of a new phone. Values rose while shipments fell, thanks to strong incentives.
Longer-lived phones: iPhones averaged 3.79 years at trade-in and Androids 3.93 years—near record highs—helped by repairs and protection plans.
Win-win-win dynamics: Carriers used aggressive offers to keep customers, and the secondary market got premium devices at lower prices, which cuts e-waste and helps buyers.
The Data Gap: National vs Regional
Here’s the catch: 2025 reports focus on national numbers. City-level or state-level price maps are still rare this year. Analysts highlight the big totals and trends, but not a five-city breakdown. That leaves room for smart shoppers to test and win fast with “US phone trade-in price differences 2025” tactics.
What Causes City-by-City Differences?
Taxes and rules: State and city sales taxes change the total cost when offers are tied to a new phone. No-tax states like Delaware play differently than big metros with higher rates. Locking and regulation can lower some device quotes too (source: trade-in overview, The Whiz Cells).
Promo density: Carriers and big retailers often fire the first shots in huge urban hubs like New York or San Francisco. Rural areas may see fewer or slower promos. Third-party buyers can beat carrier offers by 20–50% in many cases, based on model, timing, and competition.
Demand hotspots: Affluent tech-heavy cities (Seattle, Austin, NYC, LA) push higher resale values for premium iPhones. When hype spikes, local quotes can pop too. This is in line with national promo waves seen in Q1/Q2 2025.
Logistics and fees: Fast intake helps. Coastal cities with more instant options (like retail kiosks) can post stronger quotes during tight promo windows. Rural shipping time can eat into the net.
What to Expect from a Five-City Case
Based on 2025 patterns, and how promos roll through dense metros, you can see 10–25% gaps at times across US cities for the same model and condition—especially when local taxes, promo intensity, and demand all line up. That is why a quick city test can pay off. If you want a fast way to pull multiple quotes in one place, aggregator dashboards can help validate real-time gaps.
“City-specific trade-in maps are scarce in public reports right now. That actually gives you an edge. You can test quotes with ZIP codes and spot the short-lived spikes yourself.”
Your Five-City Field Guide
We’ll cover New York, Los Angeles, Chicago, Houston, and Miami. Think of this as your holiday phone trade-in promos by city radar for 2025.
New York City
Expect:
NYC is a promo magnet. Big carriers light up this market early, and resale demand is deep. During Black Friday and the New Year splash, values can edge up fast, especially for hot iPhones and top Samsung models.
How to test:
Grab daily quotes for the same phone and same condition using NYC ZIPs. Compare them to a nearby metro like Newark or Philadelphia for one promo week. If you see a 3–5% lead that holds for 3 days, NYC is your lead city.
Watch:
Metro-only gift card top-ups. Short shipping windows. Some deals tied to specific borough store pickups. Plan for fast lock-ins and quick ship-outs.
Los Angeles
Expect:
LA loves premium trims. Retailers stack promos often. On some weekends, LA ZIPs outpace NYC for specific models. Local inventory swings can be sharp after ad drops.
How to test:
Pull quotes LA vs NYC on the same day and same promo. Check Friday night to Sunday evening when ad cycles flip. Follow any extra bonuses tied to same-day pickup or courier returns.
Watch:
Timing is everything. When coastal supply tightens, LA spikes can fade in a day. Take screenshots and lock early.
Chicago
Expect:
Steady demand. Reliable shipping hubs help keep quotes even. But short pops happen when coastal markets soak up stock. Weather can slow intake late December.
How to test:
Compare Chicago vs Houston during the same nationwide promo week. Chart weekday vs weekend moves. If Chicago holds steady while others pop, that stability can be your safety play.
Watch:
Holiday snow or storms. If carriers tighten lock-in windows, ship fast or switch to a local drop option.
Houston
Expect:
Texas tax math can help when your trade-in is a credit on a new device. Lower rates than high-tax cities can boost the effective net. Cash buybacks are simple and tax-neutral at checkout.
How to test:
Run credits vs cash offers side by side on the same day. For credits, include estimated sales tax in your math. For cash, just use the posted payout. Choose the higher net for your plan.
Watch:
End-of-year clearances. Third-party buyers get competitive late December. Cash values can briefly outpace credits.
Miami
Expect:
Travel season and events can nudge demand. Coastal intake can be fast in tight promos. After Christmas, gift card promos sometimes stack.
How to test:
Pull quotes during an event week and a quiet week. Compare Miami vs Houston. If Miami prints higher during show weeks, that’s your cue.
Watch:
Dec 26–Jan 1 bumps. Post-holiday returns can shift supply and push up quotes for a few days.
Regional Price Differences
How to Do a 14-Day Holiday Test, Step by Step
Here’s a light, fast plan you can repeat each morning. It works for any model.
Step 1: Run a 14-day regional test
Each morning, pull quotes for your exact model and condition in five ZIPs: NYC, LA, Chicago, Houston, Miami. Log price, promo notes, and how long each quote holds. Flag any city with a 3–8% premium for at least 3 days. That is your lead metro for this window.
Step 2: Time your lock-in
Aim mid-week (Tue–Thu) or right after a promo drop. Many quotes hold for a few days. Lock first, then ship fast to beat intake deadlines. Watch store circulars and retailer pages for “holiday phone trade-in promos by city” language or ZIP-limited boosts.
Step 3: Choose your channel mix
Cash buyback: Simple and quick. No sales tax at checkout. Good if you are not buying a new phone today. Carrier/store credit: In some states, credits applied at checkout may lower the taxable amount on your new device. Rules vary by state. Check with your state Department of Revenue or the store’s tax calculator before you decide. Run both scenarios using your five-city data. Pick the higher net.
A Simple Two-Week Holiday Schedule
Week 1 (Dec 17–Dec 23)
- Day 1–2: Baseline. Record quotes in all five cities. Note promo tags.
- Day 3: Compare your top two cities. If one leads by 3%+, star it.
- Day 4: Recheck midday refresh. Lock if a bonus appears in your star city.
- Day 5: If no lock yet, set alerts for weekend ad drops. Prep shipping.
Week 2 (Dec 24–Jan 2)
- Day 6–7: Holiday blackout. Spot surprise gift card stackers.
- Day 8 (Dec 26): Post-Christmas bump check. Many markets move today.
- Day 9–10: Mid-week lock-in target. Choose cash vs credit with tax math.
- Day 11–14: Ship immediately. Track intake. If a new spike appears and you did not ship yet, revisit your lock.
Your Net Payout Lens: Quick Math That Matters
For cash offers: What you see is what you get. No sales tax at checkout.
For credits: If you are buying a new phone, your trade-in credit may lower the taxable amount in your state. That can improve your net. But every state is different. Confirm with your retailer or local rules before you count it.
Tip: A third-party cash buyer can sometimes beat carrier credits by 20–50% on the same day, depending on the model and promo density in your ZIP.
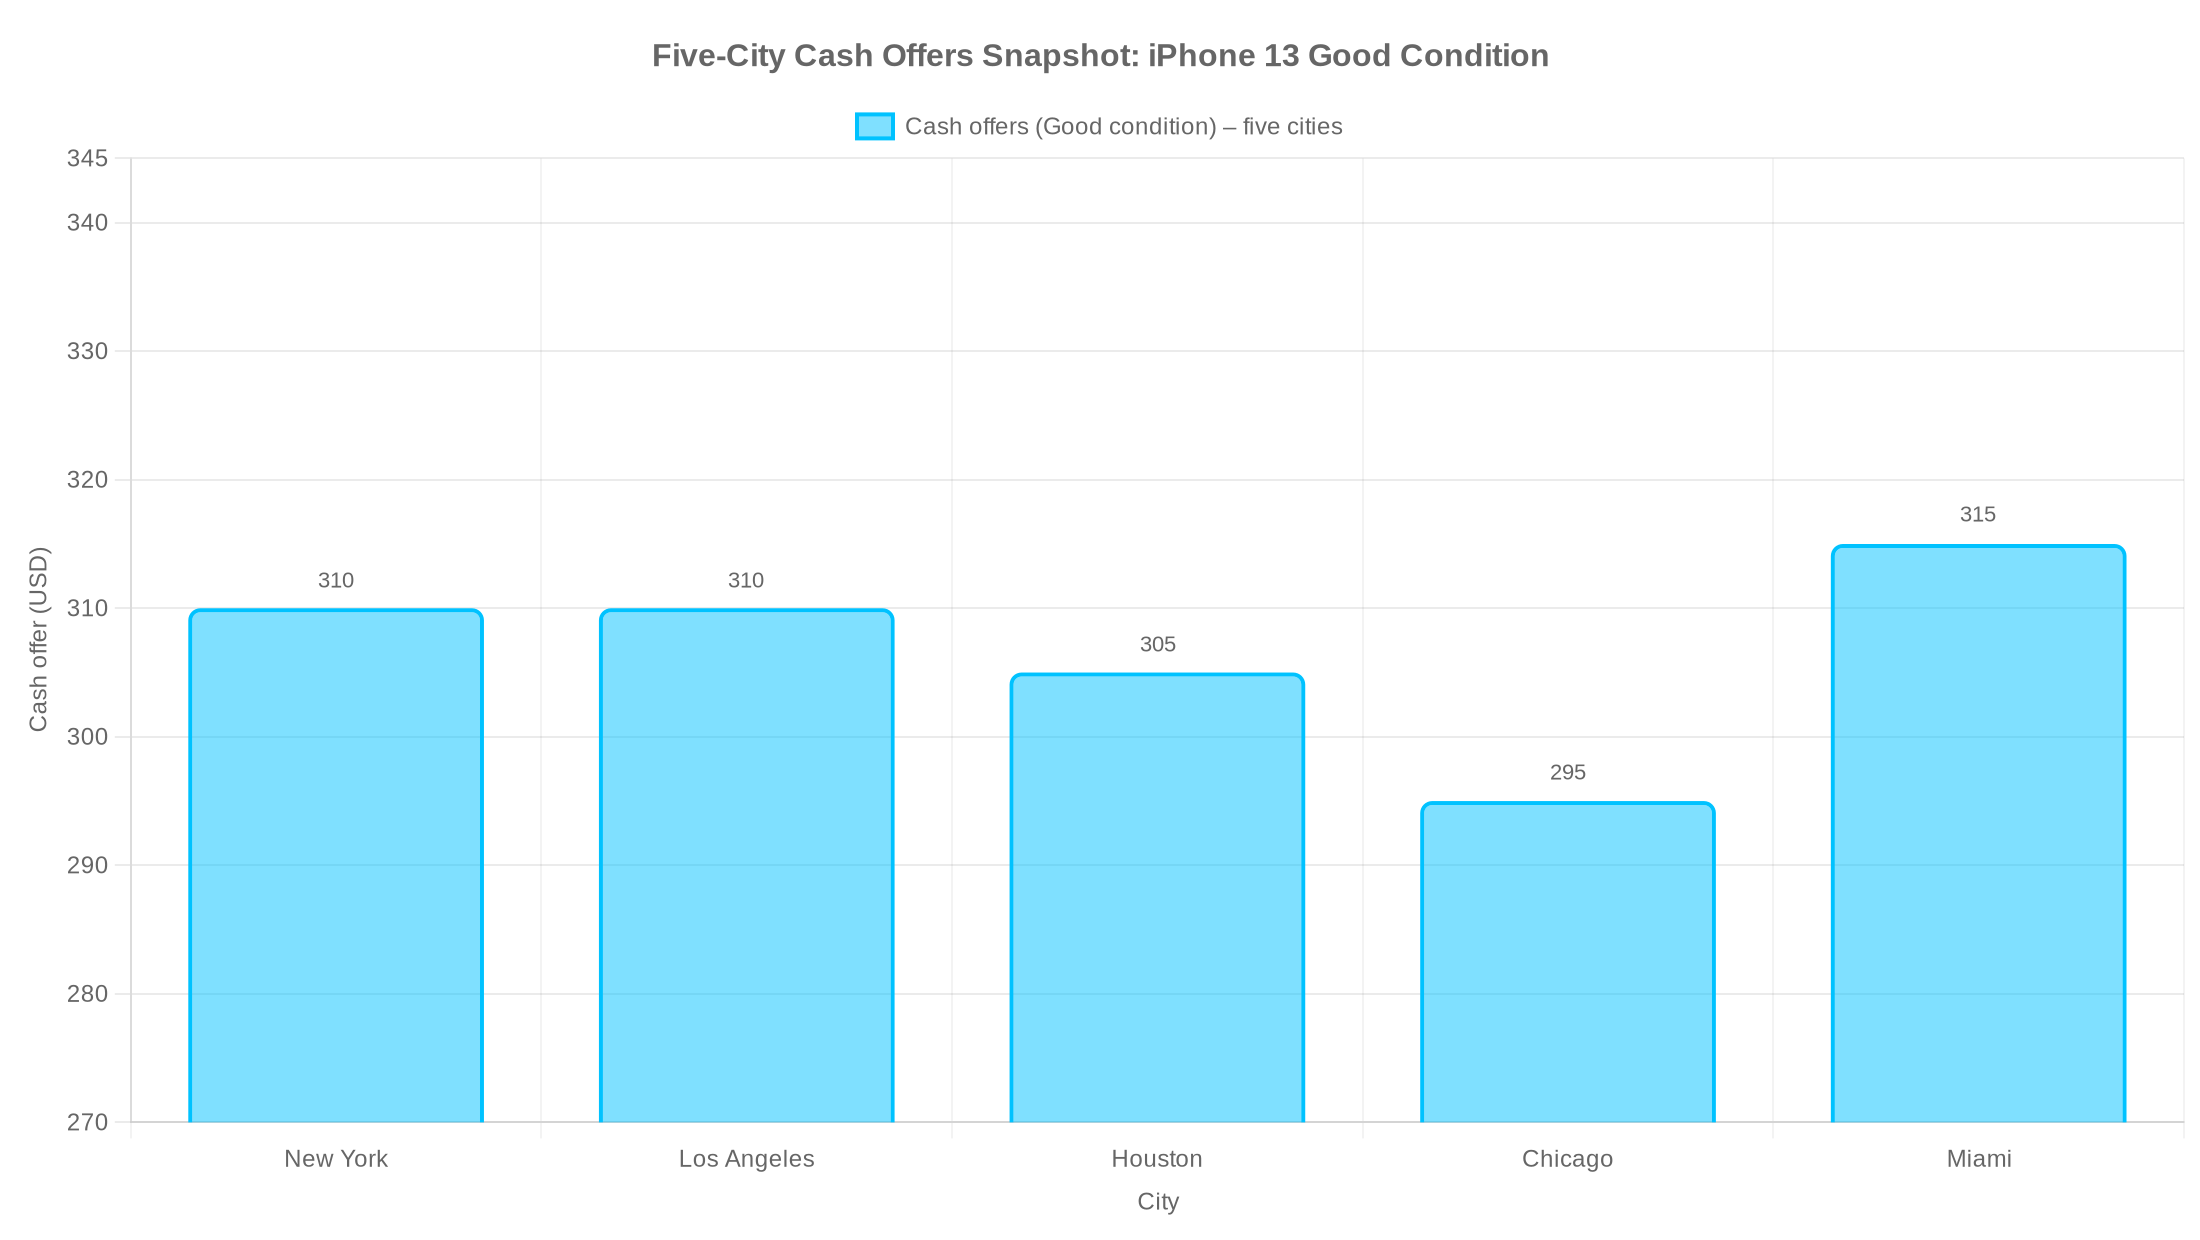
What a 10–25% Gap Might Look Like
Picture this: your iPhone 13 in good condition. On Monday, NYC and LA both show $310 credit options. Houston posts $305 cash, Chicago $295 cash, Miami $315 cash with a 3-day hold. By Thursday, LA pivots to $330 on a weekend ad drop, while Miami adds a gift card kicker.
This is why we test. Real-time city swings often line up with ad resets, weekend promos, and post-holiday returns. Pay special attention to Dec 26–Dec 28 and Jan 1–Jan 2. We often see small but real lifts in those windows. If you use an aggregator to compare quotes across buyers, you can confirm which metro is on top that day.
Signals That a City Is Heating Up
- Your model shows a 3%+ lead for three days in a row.
- A retailer adds a ZIP-limited gift card bonus.
- A carrier stacks a short-run top-up tied to in-store pickup.
- Intake times shorten (same-day courier, easy kiosk drops).
- After a big launch or ad drop, quotes refresh higher by Sunday night.
How Taxes and Rules Shape Your Final Value
“Phone trade-in taxes by state” can shape the math when the offer is a credit toward a new device. In lower-tax areas, your net can improve versus a high-tax metro when the credit reduces the taxable amount. Some markets also see different handling of locked or carrier-bound devices. These local differences can sway the quotes you see.
Your Fast Comparison Sheet
- Model + storage + carrier state
- Exact condition notes (photos help)
- Five ZIPs: NYC, LA, Chicago, Houston, Miami
- Daily quote, promo tag, hold time
- Net math: cash offer vs credit with estimated tax
Once you lock, ship fast. Keep your IMEI handy. Save photos of the device to avoid condition disputes.
GizmoGrind’s Framework for 2025 Regional Variations
Want a deeper dive on 2025 regional variation mechanics and a printable tracking sheet? See our guide here: https://www.gizmogrind.com/blog/regional-price-variations-2025
A Note on Sustainability and Smart Upgrades
Trade-ins are doing more than helping your wallet. They feed the circular market with good phones. That cuts e-waste and keeps more people connected at lower cost. Industry leaders point to this “win-win” as a key reason promos stayed strong in 2025 and may keep rolling into Q4 and beyond.
At GizmoGrind, we care about safe, clean supply. We do not accept iCloud-locked, blacklisted, lost/stolen, or water-damaged devices. That keeps the second-life market healthy and secure.
“Industry experts warn that activation lock is the number one deal-breaker for resale.”
If you plan to sell, please remove all locks first. It protects your data and your payout.
Putting It All Together: Your Holiday Edge
The backdrop: US trade-in payouts soared in 2025, hitting $1.24b in Q1 and $1.34b in Q2, with Q3 climbing to about $1.59b. People held phones longer, but promos and AI/5G upgrades pulled them to trade.
The gap: City-level trade-in maps are thin. But we know taxes, promos, demand, and logistics push quotes around daily.
The move: Run a 14-day, five-city test with ZIPs. Watch for a 3–8% lead that sticks. Lock during mid-week restocks or right after a promo drop. Ship fast.
The win: Choose cash vs credit by net payout in your state. For some buyers, cash is king. For others, smart tax math makes credits shine.
The payoff: 10–25% swings do happen. During Dec 17–Jan 2, these gaps tend to pop, then fade. Your daily check is your edge.
Frequently Asked Questions
Do US cities really pay different amounts for the same phone?
Yes, at times. Offers can vary by ZIP due to local promos, demand, and intake speed. That is why we test across multiple cities.
Is it better to take carrier credit or cash?
It depends. Cash is simple and fast. Credits may lower the taxable amount on a new device in some states. Run both nets and pick the higher one.
When is the best day to lock a quote?
Often mid-week (Tue–Thu) or just after a new promo drops. Post-holiday days like Dec 26 can bring a fresh pop.
How big are the gaps?
Expect small day-to-day moves, but watch for 10–25% gaps during hot windows. Play the week, not just the day.
What if my phone is iCloud-locked or blacklisted?
Please unlock it first. Locked or blacklisted devices are not accepted at GizmoGrind. This protects you and the next owner.
City-by-City Cheat Sheet (Quick Version)
- New York: High promo intensity. Dense resale demand. Watch weekend ad flips and borough-tied store perks.
- Los Angeles: Premium iPhone/Galaxy sweet spot. Big Sunday night resets.
- Chicago: Stable hub. Good for steady quotes. Weather can impact intake windows.
- Houston: Lower tax environment can lift effective credit net. Cash is clean and tax-neutral.
- Miami: Seasonal bumps. Fast coastal intake. Gift card stackers after Christmas.
One Last Nudge Before You Go
This regional price differences case study 2025 is your holiday playbook. Test five ZIPs. Track daily. Lock the moment your lead city lines up with the right promo. Whether you choose cash or credit, the goal is simple: get your best value, cut e-waste, and start the new year strong.
Key Sources Cited in This Story
- Q1 surge, device age, top models: Computer Weekly (Q1 2025)
- Q2 records, 5G share, promo drivers: Computer Weekly (Q2 2025)
- Q3 climb and ongoing trends: Assurant data hub
- Trade-in rise despite shipment declines, aggressive offers: Telecoms.com
- Taxes, carrier vs third-party comparisons, regional promo differences: The Whiz Cells
- Aggregated quote tools and benchmarks: SellCell
- GizmoGrind regional variation framework: https://www.gizmogrind.com/blog/regional-price-variations-2025
Happy trading—and happy holidays from GizmoGrind.