Table of Contents
Key Takeaways
- iPhones retain ~70%+ of their value after 12 months in 2025, while premium Android devices sit closer to the low‑40% range—that gap drives your entire strategy.
- Regional fees and taxes can shift your net payout by 10–15% or more. High‑tax states like CA and NY reduce carrier credit value; low‑tax states make carrier trade‑ins stronger.
- Private sale typically nets highest for clean iPhones in big metros, but marketplace fees, shipping, and scam risk add up—especially in rural zones.
- Lock quotes before January. Post‑holiday floods and promo resets can drop values 20–30%, with Pixel and Galaxy phones most vulnerable to early‑year dips.
- Privacy prep is non‑negotiable. Follow the 9‑step checklist to avoid activation‑lock rejections and speed your payout, no matter which channel you choose.
Why a regional, device‑focused plan wins in 2025
iPhones keep more of their value than Android in 2025. That gap drives the whole game. iPhone 15/16 Pro models often keep 70%+ after a year. Premium Androids sit closer to the low‑40s. That shapes when and how you sell, and which channel you pick. Independent data backs it up: iPhone resale strength beats Android again in 2025 on the secondary market.
Here’s the twist for this year: your region matters. State taxes can cut carrier trade‑in credits more in places like CA and NY. Marketplace and shipping costs bite harder in rural zones. That means two folks with the same phone can net very different payouts just by ZIP code—a reality that makes regional planning essential in 2025.
The device‑value map: iPhone, Galaxy, Pixel across channels
Let’s break it down by channel. Then we’ll zoom into models.
Private sale (eBay, Facebook Marketplace, Craigslist)
What to expect: Highest gross. Faster sales in big cities. Best for clean iPhones.
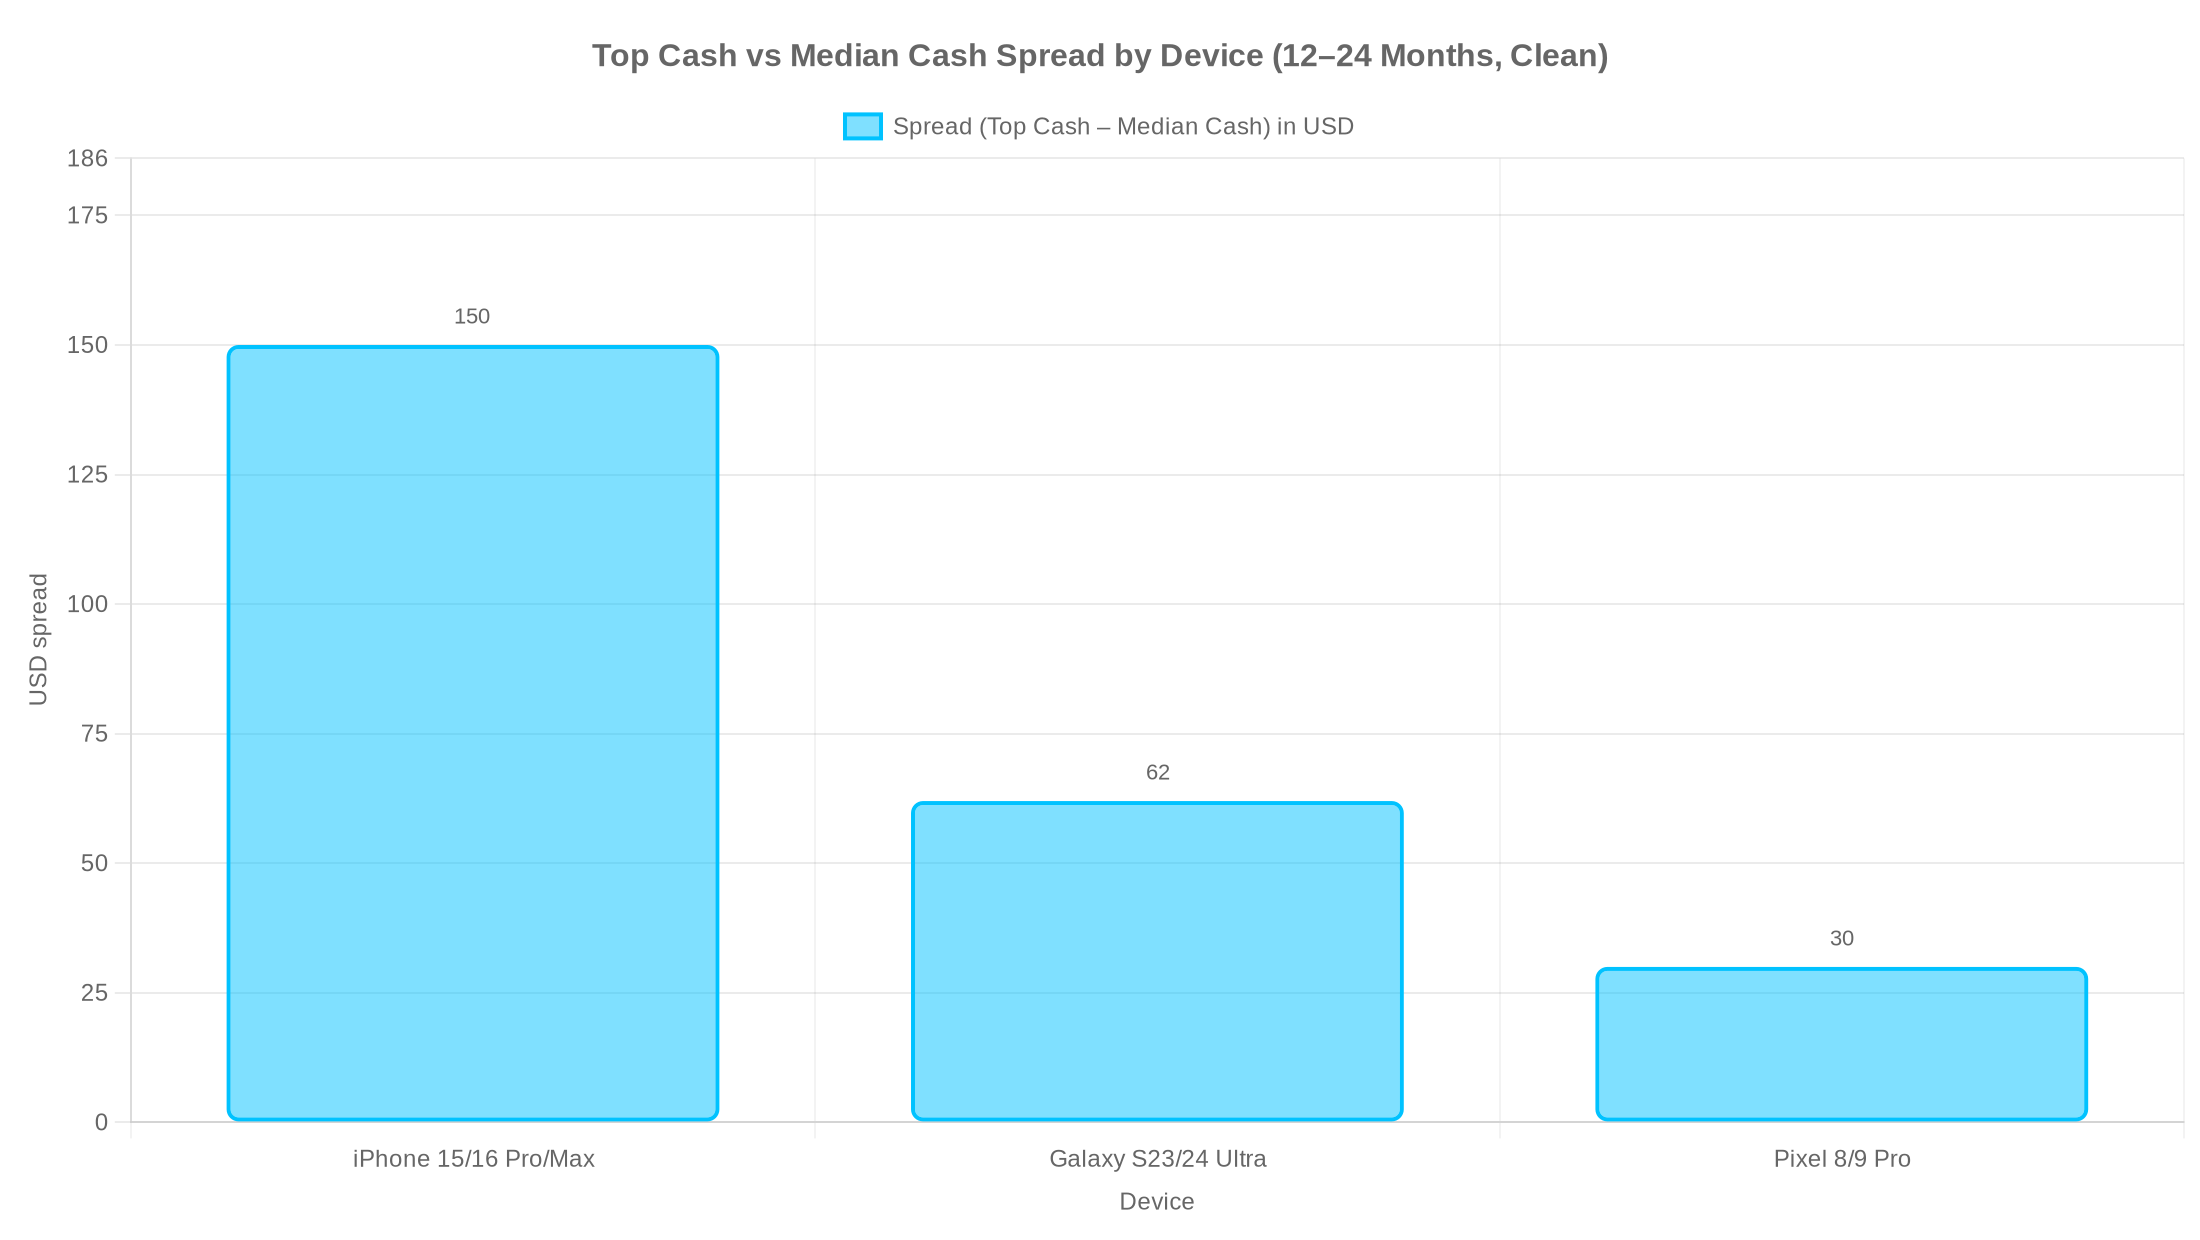
Typical numbers: After 12 months, iPhone 15/16 Pro often lists for $500–650. Galaxy S23/S24 Ultra lands around $380–400. Pixel 8/9 Pro sits near $280. iPhone leads because buyers love long support and steady demand. Android retention trails, even for premium models.
Fees to watch: eBay or payment fees can run 10–13%. Shipping/insurance adds 5–10% and is even higher from remote areas. In big metros, your listing moves faster, but buyer‑side sales tax can cool top bids a bit, which trims your net by about ~5% on average.
Risks: No‑shows, scams, and values can drop 20–30% right after the holidays if you wait too long to sell.
Buyback programs (mail‑in sites and kiosks)
What to expect: Lower but predictable quotes. Easy payouts. Less risk.
Typical numbers: Net retention often lands between ~43–69% depending on device and condition. iPhones pull higher. For instance, a 15 Pro around the $500 mark on the secondary market is common in 2025, with buyback quotes sitting under private sale but above many carrier nets. Android models trail iPhones by ~15–25% in most buyback menus.
Fees to watch: Some programs waive shipping. Others bake in small processing costs. Kiosks avoid shipping but can be far if you live rural.
Market note: iPhone trade‑in values saw a late‑year dip up to ~25% in 2025. Watch for short bonus windows, then act fast.
Carrier trade‑ins (AT&T, Verizon, T‑Mobile)
What to expect: Big “up to” credits. Bill credits spread across 24–36 months. Convenient, no shipping.
Typical numbers: 2025 carrier offers for iPhone 15 Pro Max often fall in the $600–650 range at the top end, but downgrade risks and taxes bite. Android offers for Galaxy and Pixel hover lower ($380/$280 averages), and bundle promos can move the needle for a short time.
Fees to watch: Regional taxes matter. In CA and NY, sales tax on the device price can shrink the real value of those credits by 10–15% vs a low‑tax state. Condition downgrades of 10–20% are common. Carrier‑locked devices can get hit 15–30%.
Timing note: Late‑December promos often reset in January. Android values in particular dip 20–30% as bundles end.
Model‑by‑model snapshots (12–24 months old, clean)
iPhone 15/16 Pro and Pro Max:
- Private sale gross: $500–650
- Buyback net: $450–550
- Carrier trade‑in net (after regional fees): $400–600
Why it leads: iPhones keep ~70%+ at 12 months on average in 2025, driven by high demand and longer update cycles. Independent checks agree that iPhone out‑retains Android again this year. Late‑year drops did hit some trade‑in menus, so timing still matters.
Galaxy S23/S24 Ultra:
- Private sale gross: ~$380–400
- Buyback net: ~$320–350
- Carrier trade‑in net: ~$300–380
Why it trails: Premium Androids do better than mid‑range, but still sit near the low‑40% retention band in 2025. Trade‑in trends confirm this gap across platforms.
Pixel 8/9 Pro:
- Private sale gross: ~$280
- Buyback net: ~$240–260
- Carrier trade‑in net: ~$220–280
Timing twist: Pixel values are often strong right at launch, then soften into January. Lock quotes before the post‑holiday reset if you can.
Quick takes people search for in 2025
Sell iPhone vs trade in to carrier: If you want max cash now, private sale usually wins. If you plan to stay on your carrier for 24–36 months and like low monthly bills, big bill credits can be worth it—especially in low‑tax states.
Galaxy private sale vs trade‑in 2025: Because Android depreciation is steeper, compare buyback quotes before you sign a carrier promo. A strong buyback can beat a weak carrier deal once you adjust for taxes and lock‑ins.
Pixel trade‑in vs private sale 2025: Pixels do best early in the cycle, then cool fast. December is better than mid‑January. Lock quotes now if you want to beat the dip.
The regional‑fees lens: build your “real net” for your state
Regional taxes and access change the winner. Here’s the simple way to see your true number.
Net = headline price or credit − sales tax hit on carrier credits − marketplace/payment fees − shipping/insurance − activation or restocking − access costs (time to a kiosk, etc.).
Use this for each channel. Then compare.
High‑tax/coastal states reduce carrier edges:
CA, NY, NJ: Sales tax of about 8–10% means you pay more tax on the device price when you use carrier bill credits. Your “real” savings may be 10–15% lower than the headline number, so cash options can pull ahead for the same phone.
TX, FL, GA: Lower taxes help carrier credits play strong. But rural sellers may pay more to ship a private sale, which eats into the gap.
Rural Midwest/West: Kiosk and store access can be limited. Shipping a private sale can cost 10%+ when you add insurance. In these zones, buybacks or carriers can win on net, even with lower base quotes.
A tiny calculator you can use right now
Let’s say you’re in California with an iPhone 16 Pro Max. You see:
- Private sale list price: $620
- eBay + payment fees: 12%
- Shipping + insurance: 6%
Your private sale net is $620 − $74.40 − $37.20 = $508.40.
Carrier trade‑in headline credit: $650 spread over 24 months.
- CA sales tax on device price cuts your real benefit. Assume an effective 10% impact ($65).
- Possible condition downgrade at intake: −$50.
Your carrier net is roughly $650 − $65 − $50 = $535 in value spread over the term.
Result: In CA, it’s close. If you want cash today, $508 net private sale might beat a 24‑month lock. If you’ll keep that carrier for 2 years anyway, the $535 over time may be fine. In low‑tax states, that same carrier path likely wins by more.
Privacy‑first selling: a 9‑step toolkit
Good prep boosts trust, speeds payout, and stops deal‑breakers like activation lock. Do this before you list or trade:
- Back up your phone locally and/or to the cloud.
- Sign out of iCloud or Google.
- Turn off Find My. Then factory reset.
- Unpair your Apple Watch or wearables.
- Remove your SIM, or transfer your eSIM.
- Check IMEI/ESN is clean.
- Wipe the case and screen; clear ports.
- Take photos in daylight; document any marks.
- Keep proof of handoff or drop‑off.
Follow this checklist to avoid the number‑one resale killer: activation lock.
“Sell timing” in Q4 and early Q1: what changes in January
The calendar matters as much as the phone. December promos are hot. Then January resets bring dips. iPhone 17 buzz in September pulled many upgrades forward, which lifted iPhone secondary demand and shaped year‑end trade‑in menus. But late‑year we still saw 10–25% trade‑in declines on some lines, so watch the window and move.
Seasonal demand patterns also swing prices. Post‑holiday, listings flood and buyers pause. That’s why private sale prices can fall 20–30% if you wait too long. Goal: test prices now, lock a quote, and avoid mid‑January dips.
The 60‑day, region‑aware playbook to maximize value (Q4 2025)
Days 1–14: Build your net
Pull three quotes per channel for your exact model and condition. Use the net formula with your state’s tax reality. Add marketplace fees and shipping for private sale. Add likely downgrades for carriers if you have any scuffs. If the top net beats the next option by 10% or more, circle it. If not, speed wins. Keep timing in mind. Post‑holiday dips are coming, so act before the reset.
Days 15–30: Lock and list
If you’re jumping to a new phone, compare the total cost of a carrier upgrade (with credits and taxes) versus selling for cash and buying unlocked. If your best net is private sale, list now with clean photos and a fair price. If it’s buyback, lock your quote before January adjustments. For iPhone, late‑December is prime time to lock. For Pixel, it’s even more urgent due to early‑year softening.
Days 31–60: Re‑quote if you wait
If you’re holding until February, re‑check quotes. Avoid mid‑Q1 lows. If promos restart for carriers, re‑run your calculator.
Real‑world scenarios (region + device + channel)
Scenario A: Urban CA, iPhone 16 Pro Max
You live in Los Angeles. You plan to upgrade. A carrier headline looks huge, but CA taxes cut the bill‑credit benefit. Private sale nets around $500 after fees and shipping. Carrier nets around the mid‑$500s but locks you for 24–36 months. If you want freedom and fast cash, private sale wins. If you’re staying put, the carrier plan is fine. iPhone retention and urban demand help both paths.
Scenario B: Rural Midwest, Pixel 9 Pro
You live an hour from the nearest kiosk. Private sale shipping plus insurance takes 10%+. Local demand is slow. A mail‑in buyback or carrier trade‑in saves you time and holds more of its headline net. Act before January resets, because Pixel prices slip faster after the holidays according to industry trade‑in trends.
Scenario C: NYC, Galaxy S24 Ultra
You can private‑sell fast in the city. But carrier menus look rich in December. Lock a December quote or go private sale. Expect a mid‑January dip as promos roll off and buyers cool. Run both nets with NYC’s tax baked in.
Picking the best way to sell my phone 2025: a simple rule
- If private sale nets at least 10% more than buyback or carrier, go private sale.
- If not, choose the fastest, least risky payout for your region and timeline.
- For iPhones, pre‑January private sale often rules in big metros. For Android, buyback or carrier in low‑tax states can be the smart, calm choice.
Brand and model notes you can use now
Buyback vs carrier trade‑in for iPhone 16: If you want cash and freedom, buyback or private sale beats a 24–36 month lock. But in TX or FL, low taxes can make carrier credits very strong once you do the math.
Buyback vs carrier trade‑in for Galaxy S24 Ultra: Check both before you move. Private sale can do better in NYC, LA, and other big markets, but buyback can win in rural areas due to shipping and speed.
Buyback vs carrier trade‑in for Pixel 9 Pro: Lock a December quote if you can. Private sale value fades in January, so a guaranteed buyback looks better after the reset.
Timing guardrails for 2025
- iPhone dominates value retention in 2025. Expect ~70%+ at 12 months vs ~43% for Android on average.
- For Android, trade at 12–18 months to beat steep depreciation curves.
- Avoid post‑holiday dips if you can. Private sale markets get crowded in January.
- Watch for short promo windows, then act. Late‑year trade‑in menus fell up to ~25% on some iPhone SKUs in 2025.
How GizmoGrind helps you win
We built our process for clarity, speed, and safety. We show you data‑backed ranges by model and channel and help you see your true net after regional fees. Use our privacy checklist and compare options in minutes. We pay fast. And we only accept clean devices—no iCloud‑locked, blacklisted, lost/stolen, or water‑damaged phones—so you know the process stays safe and fair for everyone. If you choose private sale or carrier this time, that’s fine too. Our goal is simple: help you maximize value and cut hassle.
Actionable takeaways and a quick‑start checklist
- Identify your exact model and condition. Pull three quotes per channel.
- Apply the regional‑fee calculator. Include taxes on carrier credits, fees, and shipping.
- Pick the channel that wins by at least 10% net. Otherwise pick the fastest and safest path.
- Complete the privacy checklist. Keep proof of handoff or drop‑off.
Frequently Asked Questions
Is private sale better than carrier trade‑in in 2025?
It depends on your state and timeline. In high‑tax states, private sale can net more after fees than carrier credits. In low‑tax states, carriers can win, especially if you’ll stay for 24–36 months.
How much more is private sale than trade‑in on average?
For clean iPhones, private sale can beat buyback by ~10–25% and beat carrier nets by a similar range after taxes—if you avoid scams and keep fees down. For Android, the gap is smaller due to steeper depreciation.
When should I sell in Q4 2025?
Late December is strong. Values dip in January as promos reset and listings pile up. Lock a quote now if you can, especially for Pixel and Galaxy.
What’s the best way to maximize iPhone trade‑in value in the US?
Sell before January, list clean, include full kit (box and cable help), and pick the channel that nets 10% more after taxes and fees. iPhones keep the most value, so timing and prep pay off.
What about Galaxy and Pixel?
Trade or sell within 12–18 months. Android values slide faster, so speed matters. Compare buyback and carrier first, and only go private sale if your region has strong demand and low fees.
A closing nudge
You don’t need to guess. Run the numbers for your ZIP and your phone. Private sale vs buyback vs carrier trade‑in 2025 regional fees is not a slogan—it’s the lever that decides your true net. Build your quick calculator. Lock your quote. And beat the January dip while the window is still open.
Citations and source notes in context
- iPhone vs Android value retention and timing: iPhones lead in 2025 retention; Android depreciates faster and iPhone resale strength confirmed again in 2025.
- Regional timing, taxes, and market realities: State taxes and access shift net values by 10–15% or more; January resets can trim prices.
- Privacy prep: 9‑step checklist to keep your data safe and speed payout.
- Seasonality and macro timing: Post‑holiday dips; plan the sale window and maximize your timing strategy.
- iPhone 17 cycle context: Upgrade waves shape late‑year menus and demand.
- Late‑year trade‑in drops: Some iPhone trade‑in values fell up to ~25% in 2025; jump on bonuses.
- General value retention context: iPhone leads; Android trails and buyback trends by brand.