Table of Contents
Key Takeaways
- iPhones deliver higher trade-in payouts in 2025—often 15–25% more value retained versus the average Android, with Pro models holding 70%+ after 12 months.
- Timing is everything: Android owners should sell within 12–18 months to beat steep depreciation; iPhone users have more wiggle room.
- December 2025 promos are live—lock quotes before new flagship launches to maximize ROI.
- Battery health matters: Keep it above 80% to protect top-tier grading and payouts.
- Top Android flagships are improving in percentage retention, but iPhones still win in absolute dollars.
2025 Scorecard: Who Gets the Bigger Check?
Let’s start with the numbers in U.S. trade-in channels. iPhone leads—it posts the highest resale and trade-in payouts in 2025 across Apple Trade In, carriers, and buy-back sites. Buyers pay more for used iPhones, and that pushes offers up fast.
By 12 months, the average iPhone is worth about 69% of its original price. The average Android sits around 43%. That’s a big early gap. iPhones hold 15–25% more of their value than Android rivals like Samsung and Pixel, based on 2025 comparisons.
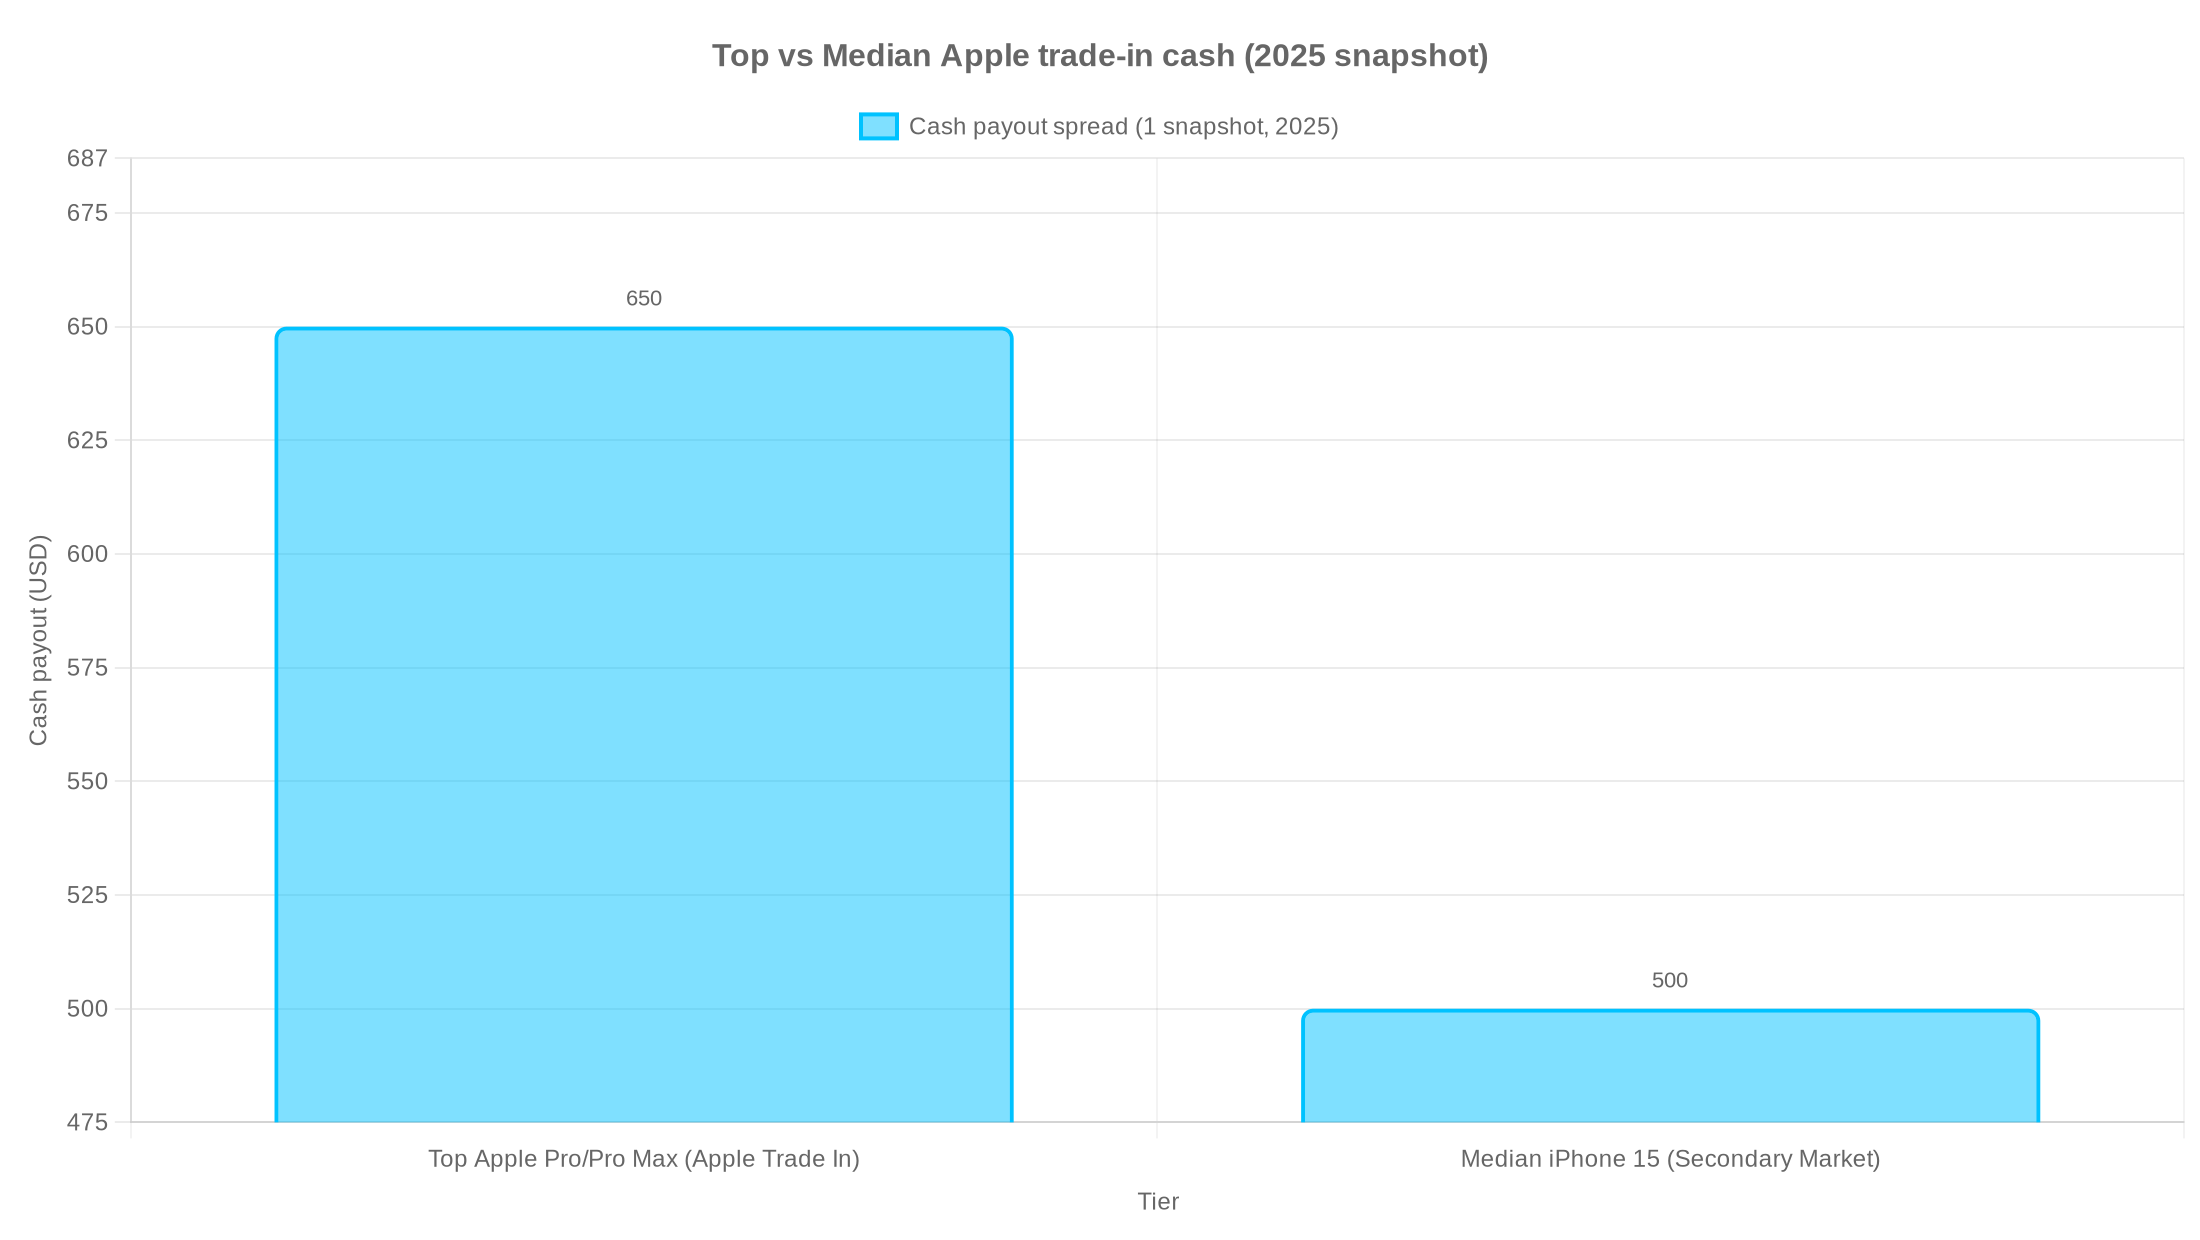
Drill down to real phones: The iPhone 15/16 Pro line often holds 70%+ of its original value after about 12 months. In 2025, Apple’s own program hits up to $600–$650 for clean 15 Pro/Pro Max trade-ins. Secondary markets hover near $500 for a clean iPhone 15.
The Galaxy S23 tells a different story. Used units sit around $380 in many secondary markets—roughly $120 below a comparable iPhone 15 in most 2025 channels. Prior models fell fast too: the Galaxy S22 lost ~58.2% over nine months; the S23 lost ~53.4% in the same window.
Platform averages still favor iPhone, and you see that in carrier promos too. For example, Verizon has offered around $800 for an older iPhone 12 versus closer to $400 for a Galaxy S21 of the same year—a 2x difference on similar-aged phones, which tracks with the 12-month gap.
Takeaway for U.S. upgraders: If you plan to trade in after 1–2 years, iPhone reaches top payouts first and holds that edge more reliably. Top Android flagships (think Galaxy S Ultra and Pixel Pro) are narrowing the percentage gap, but they still trail in pure dollars most of the time.
Timing: Who Falls Off a Cliff First?
Here’s where strategy beats luck. iPhones decline slower—they keep respectable offers 3+ years in, especially with Apple’s own program as a safety net. A three-year-old iPhone can still bring a decent amount through official channels.
Androids drop faster early. On average, Android phones lose about half their value in the first year. A $1,200 Android might be worth around $600 after 12 months, while a $1,200 iPhone lands closer to $900. Sellers with Android need to move faster before values fall.
Seasonality is real. Peak windows hit in late summer/early fall (right before big launch waves), and again during December holiday promos. December is prime time for padded trade-in credits and upgrade bonuses.
Put simply: Android owners benefit the most from selling early, before the next big Samsung/Pixel cycle. iPhone owners have a bit more wiggle room.
Why iPhone Reaches Top Payouts First
Software support and useful life
This is the big one. iPhones get 5+ years of iOS updates. Buyers know a used iPhone will stay secure and usable longer—so they pay more. This longer life is cited as the number one reason iPhones hold value better in 2025.
Many Android phones still get about two years of major OS upgrades. Samsung and Google are improving at the top end, but the broad market perception still lags. A shorter perceived lifespan lowers bids on the resell side.
Brand perception and buyer demand
Apple sells as a premium brand. Premium goods tend to keep value longer. Demand for used iPhones in the U.S. and worldwide stays high—that keeps trade-in values high too. Carriers and refurbishers like the predictability. It’s easy to sell a used iPhone.
Android is mixed. Samsung and Pixel flagships do well. Mid-range and low-end models flood the used market and fall fast. That pulls the “average Android” number down.
Ecosystem and trade-in infrastructure
Apple’s own trade-in program helps keep older iPhones worth something. Carriers push aggressive bill-credit deals for iPhones too. Those deals keep the iPhone resale loop strong. Other brands have less consistent programs. The safety net for Android is thinner, and that shows up in pricing.
Android Is Catching Up in Percentages (But Dollars Still Favor iPhone)
The Android picture is improving, especially at the top tiers. Samsung’s flagship S series has been gaining about 5% per year in value retention—that’s a real trend. Meanwhile, iPhone’s value retention has softened a bit, slipping around 5.6% year-over-year in recent data. The gap is shrinking.
Looking ahead, some projections suggest percentage losses will keep narrowing into 2027. One forecast shows iPhones down ~46.1% and Samsung ~43.1% over a similar period. Even if that happens, iPhones still win on absolute dollars because they start higher and keep more money in hand.
Trade-In vs Total Cost of Ownership (TCO)
Trade-in is not just a one-time check. It’s part of your total cost. iPhone: Higher upfront price—but stronger resale can lower the effective cost per year if you upgrade every 1–3 years.
Android: Huge range of prices. You can buy cheap. But some mid-range devices sink fast, so the “cheap now” pick can turn costly over 2–3 years.
Think of it like this: Net Cost = Purchase Price – Trade-In Value
If your iPhone holds 69–70% after a year, you pay less per year than you think. If your Android holds ~43% after a year (unless it’s a top flagship), you may pay more per year than the sticker price suggests. That’s the heart of android vs iphone total cost of ownership in 2025.
Case Studies: 2-Year ROI in Practice
Case A: iPhone 15 vs Galaxy S23 in 2025
Purchase reality: Both launched as premium phones. 12-month value: iPhone 15 often fetches around $500 in secondary markets, and up to $600–$650 in Apple Trade In for Pro/Pro Max tiers. The Galaxy S23 hovers near $380. That’s a big dollar gap even when percentage gaps narrowed.
If you bought at launch and upgrade every two years, the iPhone 15 gives you more to put toward the next device. You’ll feel it in your monthly bill or your cash-in-hand. That’s why “iphone 15 vs galaxy s23 trade-in value 2025” is so lopsided in dollars.
Case B: iPhone Pro vs top Android flagships on a 24-month cycle
Year 1 snapshot: Average iPhone ~69% vs Android ~43% retained. Year 2 glide: iPhones decline slower and keep “respectable” offers even at year 3. Premium Androids can hold up ok, but mid-range Androids lag badly.
Result: If you plan for a 24-month trade, iPhone tends to win in real cash, even when percentage differences narrow at the very top. If you want absolute dollars to apply to your next phone, iPhone is the safer bet in 2025.
Timing Plays for December 2025 and Early 2026
Here’s the calendar move set. December holiday promos: Carriers and buybacks raise trade-in credits. If you see bill credits you like, this is your window.
Pre-announcement sweet spot: For Android, list or lock quotes before Galaxy/Pixel launch news hits. Once new models leak hard, older models dip. iPhone timing: You have a slightly wider margin. But it still pays to move before new colorways and storage promos bend the curve.
A quick note on bill credits vs cash: Some readers like bill credits for the “set it and forget it” feel. A user said it well:
“AT&T seems to give good trade in value for a long while after the phone’s release, and I’d be able to tack the difference onto my phone bill for a while.” — TesseractUnfold (X)
— AT&T seems to give good trade in value for a long while after the phone's release, and I'd be able to tack the difference onto my phone bill for a while. Depending on how finances go, that might be my next bet.
Another cost concern: Finding a good case. ^^; Took me WAY too…
— Eric H (@TesseractUnfold) November 27, 2025
Bill credits can be great. Just remember, credits lock you to that carrier plan, while a cash payout keeps you flexible.
The GizmoGrind 2-Year ROI Calculator (How to Use It)
You don’t need a spreadsheet. Use this simple math:
Step 1: Enter your phone’s price.
Step 2: Estimate your 12–24 month trade-in using the values and timing tips above.
Step 3: Adjust for battery health and grade.
Step 4: Add any promo multiplier (carrier bill credit bonus or holiday bump).
Step 5: Net Cost Per Year = (Price – Expected Trade-In) / Years You Used It.
Example: iPhone 16 Pro vs Android flagship, 2 years
iPhone 16 Pro price: $1,000 (round number for easy math).
Trade-in after 24 months: use the “iPhone holds more value longer” rule and current 12-month data (~69%). If you sell at 24 months, assume a healthy cushion vs Android. Let’s say a conservative $500–$600 if you keep it clean and sell in a peak window.
Net cost per year: ($1,000 – $550) / 2 = $225/year.
Top Android flagship price: $1,200.
Trade-in after 24 months: the first year hit is steeper (average 43% after 12 months). Year 2 flattens some on flagships but still trails in dollars. Let’s say $400–$500 in a good window.
Net cost per year: ($1,200 – $450) / 2 = $375/year.
Now change one lever: Battery Health. If your battery dips under 80%, many graders cut value. If you stay at 80%+, you protect the top tier. A small battery bump can swing $50–$100 in your favor.
Pro tip: Lock quotes a week before a big launch. Then ship fast. Two weeks can be the difference between “okay” and “oh wow.”
Practical Playbooks to Maximize Payout
For iPhone owners
- Best window: Trade in between 12 and 24 months. Watch Apple events and holiday promos. That’s when offers spike.
- Keep battery health at 80%+. Avoid deep discharge cycles. That’s a common grading line.
- Avoid heavy damage. A clean phone pulls top-tier money.
For premium Android owners (Galaxy S / Pixel)
- Timing is more critical. Sell or trade within 12–18 months, and try to beat the next flagship cycle.
- Target channels that know Samsung/Pixel well and give guaranteed quotes in writing. This reduces “surprise” downgrades.
For mid-range Android buyers
Expect fast depreciation. Some mid-rangers lose value almost right away. Plan to keep the phone longer and treat trade-in as a bonus, not a core budget piece.
Smart move: Buy last year’s premium model instead of a new mid-range phone. You get better hardware and a better resale path.
Why the iPhone Advantage Exists (And What’s Changing)
Let’s connect the dots in plain words. iPhone has the clearest upgrade path. Apple supports the phones longer. Buyers know that. Buyers pay more for that. And Apple plus carriers anchor strong trade-in programs year after year.
Android is improving at the top. Samsung and Google are pushing more years of updates. Value retention is rising. The percentage gap is shrinking. But the cash gap still favors iPhone because absolute dollars matter most at checkout.
“Which Holds Value Better: iPhone or Android in 2025?”
Short answer: iPhone. Still iPhone. The data shows iPhones hold 15–25% more of their value on average in 2025. And they often keep 70%+ at 12 months for Pro lines. Android’s best phones do better than the Android average, but the average is pulled down by mid-range and budget devices.
“iPhone 16 vs Android Flagship” and the 2-Year Upgrade Cycle
If you are choosing between an iPhone 16 Pro/Pro Max and a late-2024/2025 flagship like Galaxy S24 Ultra or Pixel 9 Pro, here’s a simple frame: Two years from now, your iPhone trade-in is likely to be worth more in dollars, even if the Android flagship shows better-than-average percentage retention. The iPhone’s combo of brand, updates, and channel support keeps its floor high.
That higher floor is what lowers your net cost per year. If you care about total cost, pick the phone that keeps more dollars in your pocket when you trade it in.
Channel Map: Cash vs Bill Credits vs Brand Programs
Apple Trade In: Strong, simple, and reliable. Great floor values that keep iPhone resales supported over time.
Carrier promos: Massive in December. They often come as bill credits spread over many months. Larger headline numbers can lock you to a plan. Decide if flexibility or headline value matters more to you.
Online buy-back or marketplaces: Clean, fast cash. Good for flexibility. Shop quotes, lock promos, ship quickly, and mind battery health and grading rules.
Battery Health = Payout
One more time because it matters. Many graders use 80% as a line for iPhone battery health. Stay at or above that, and you protect your grade. Android grading also weighs battery and screen state. It’s the easiest lever you control daily.
“Falls Off a Cliff” Watchlist
- Android mid-range phones: Steep early drops. Sell early if you plan to upgrade soon.
- Android flagships: Better retention than the average Android, but still more fragile timing. Sell before the next S or Pixel launch cycle to avoid those sharp dips.
- iPhones: Smoother curve. December promos or pre-launch windows can goose your ROI even more.
Your 2-Year Upgrade Checklist
- Watch the calendar. Hit December promos or pre-launch windows.
- Keep your battery healthy. Aim for 80%+ at trade time.
- Keep it clean. Small scratches add up. Cases pay for themselves.
- Lock written quotes. Then ship fast to avoid repricing.
- Pick the right channel. Cash for flexibility. Bill credits for headline value. Brand trade-ins for simple floors.
A Quick Word on “android vs iphone depreciation rate 2025”
Depreciation rates tell the story. In 2025, the average iPhone keeps about 69% after year one. The average Android keeps about 43%. Android’s top dogs are closing that gap bit by bit, increasing about 5% in retention year over year, while iPhones have softened slightly by about 5.6% in recent data. But day-to-day sellers feel dollar amounts most. That’s where iPhone still wins.
Wrap-Up: The 2025 Answer
If your goal is the best trade-in ROI on a two-year cycle, iPhone still offers the highest, fastest, and most reliable payouts in the U.S. in 2025. Android’s flagships are improving in percentages, but the cash gap remains.
If you buy Android, target the top tier and time your sale well. Beat the launch cycles. Lock quotes while values are hot.
Start Your 2-Year ROI Check
Ready to run your numbers? Get a fast, firm quote with GizmoGrind. Then plug it into the simple calculator above to see your net cost per year. We pay fast, and we make it easy. We also promote reuse and recycling. Note: We don’t accept iCloud-locked, blacklisted, lost/stolen, or water-damaged devices.
Upgrade smart. Sell at the right time. And make your phone pay for your next one.
Frequently Asked Questions
Which phone holds its value better in 2025: iPhone or Android?
iPhone holds its value better—retaining about 69% after 12 months versus Android’s 43%. iPhones also hold 15–25% more value than flagship Android devices on average.
How much is an iPhone 15 worth in trade-in during 2025?
A clean iPhone 15 fetches around $500 in secondary markets, with Pro and Pro Max models reaching $600–$650 through Apple Trade In. Condition and battery health above 80% help you stay in the top tier.
How fast do Android phones depreciate compared to iPhones?
On average, Android phones lose about half their value in the first year, while iPhones retain around 69–70%. Top Android flagships like the Galaxy S Ultra and Pixel Pro are closing the percentage gap but still trail in absolute dollars.
When is the best time to trade in my phone in 2025?
December holiday promos and pre-launch windows (late summer/early fall) offer peak payouts. For Android, sell within 12–18 months to beat steep depreciation. iPhone owners have more flexibility but still benefit from seasonal spikes.
Does battery health affect my trade-in value?
Yes—graders often use 80% as the cutoff for top-tier payouts. Dropping below that threshold can reduce your offer by $50–$100. Keep your battery healthy by avoiding deep discharge cycles.
Are bill credits or cash payouts better for trade-ins?
Bill credits offer larger headline values but lock you to a carrier plan for 24–36 months. Cash payouts give you flexibility to switch carriers or use the money immediately. Choose based on whether you value flexibility or maximum credit.
What is the net cost per year of owning an iPhone vs an Android flagship?
Because iPhones hold 15–25% more value, your effective cost per year is often lower despite a higher purchase price. Use the formula: (Purchase Price – Trade-In Value) / Years Used to calculate your true ROI.